To get started, please install pythonika and download my sample notebook. Change the first line to point to your compiled executable of pythonika.
Then replace "USERNAME" and "PASSWORD" in the following line with your google account.
Evaluating the python cell, will download the daily search data of "AAPL" in the last 90 days. To limit the search to the last 30 days, the date variable must be set to "today 01-m." An important note, any data beyond 90 days are averaged over a week and will need to be parsed in a manner different from the example here.
This command will parse the CSV data for the dates and total daily searches:
Since I am interested in the financials of Apple (AAPL), specifically its daily traded volume, I have set :
The variables googstartdate and googenddate are automatically set to the date range indicated in the first cell. The next part of the code is used to pair up trading dates with query dates, filter out the weekends, and remove lines with missing data.
There may be a more efficient method of matching two lists of unmatched lengths in Mathematica, but this was the first one I thought up that could account for holidays. Essentially, I have created a set of {dates, queries} and another set of {dates, stock volume} and must match the dates up to create one set of {dates, queries, stock volume}. First I joined the lists together, then I reordered the two lists by:
The new set will contain disparities from weekends and possibly blank results from the Google Insight data. To filter out these disparities from the new set, this command is applied:
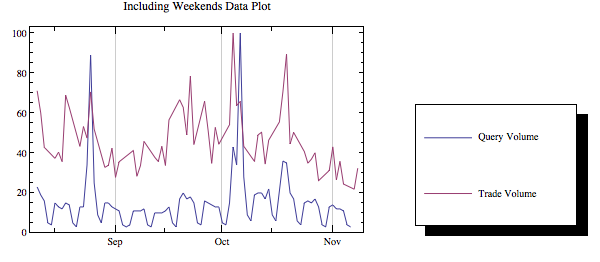
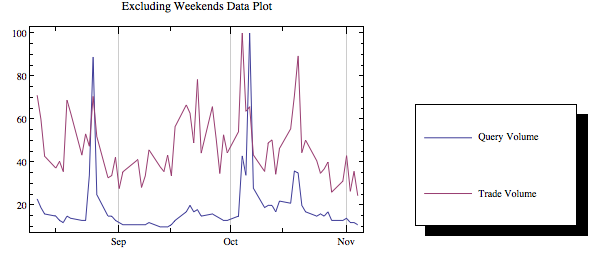
A quick plot of the filtered data and unfiltered data will show if weekends were properly filtered out.
 |
| Unfiltered for weekends data |
 |
| Filtered for weekends data |
There have been a few papers that prove query volumes can be used to predict trading volumes. But anyone can clearly see this is not the case with Apple. This observation can be quantified with a direct Granger Causality test. I have provided the code necessary to perform the test, but I leave it to the reader to test the lag sensitivity and establish the causal relation or feedback. I will explain the code used for the Granger Causality test.
To create a new set in the form of {ylag1, ylag2, ylag3, xlag1, xlag2, xlag3, y} with a max lag of 3:
The Mathematica notebook for this post can be downloaded here.


No comments:
Post a Comment