Saturday, November 26, 2011

Making Sense of Census-less Data

I have always found that supplemental 3D visualizations help provide better insights on census data. While playing with the compiled data from the 2000 census, from cityofchicago.org, I found an interesting anomaly.


After some investigation, I found the red spike represents 15 families with a median income of $255,000. Was there mischief afoot by those 15 families?

I'll let the more curious readers decide. Attached here is the census data and a Mathematica notebook. The notebook has been generalized to allow users to create 3D visualizations of all provided census data.

Download here

Thursday, November 10, 2011

Batman Letterhead in ScribTeX

As soon as I made my last post, I got a few emails asking how to use LaTeX to create the Batman letterhead.


Through the magic of "the cloud," there is an easy way to play with the letterhead I created without downloading LaTeX. First, download the source file, here.

There is a great website called ScribTeX that allows the compilation of TeX files through the website. Signing up is painless and free. Once you have signed up and logged on, you will see the Dashboard page. Click on New Project and you will be asked to name the new project. I chose the name "Batman Letterhead."


Then upload the TeX file containing the letterhead.


For the TeX file to compile properly, you must change the compiler to latex from ScribTeX's default pdflatex compiler. The pdflatex compiler compiles directly to a pdf. The latex compiler will create a postscript file before creating a pdf. The packages used to plot the Batman logo (pstricks and pst-plot) only make sense to postscript files and cannot be used with pdflatex. To change the compiler, click on "Settings" from the project page then the "Compiler Settings" tab.  After choosing latex, click "Save" then "Files."


Now open the uploaded TeX file and you will see that it is the same file as my previous post with one major difference. Instead of using a separate file containing the data points, this one has the data points stored within.


To compile the letterhead, click "Compile" and a new window will open with the compiled PDF.


The TeX file used in this post can be found here. Enjoy TeXing as Batman!

Batman Letterhead

After reading a post from HardOCP that gave the roots of the Batman symbol, I could not help imagining the letterhead of the world's greatest detective. The letterhead needs to say "Batman is classy."


I created this letterhead using the "Batman equation", Mathematica, and LaTeX. The computer in the Bat Cave is probably Unix-based and cannot use Microsoft Word. Therefore, Batman must use LaTeX. The first step to creating this letterhead is to plot the symbol. A post from Playing With Mathematica has done this for me already with seven simple lines.


The Show function is used to overlay the six plots to reveal the desired product.


To extract the points used for the final plot the following command must be executed for each root equation.


After extracting and compiling all data points into one .dat file, we are ready to create the letterhead in LaTeX. The following LaTeX code relies on the pstricks and pst-plot packages. It plots the points in the saved data file and creates the bar that separates Batman's contact information.

\begin{document}
\readdata{\BatData}{BatData.dat}
\noindent\begin{minipage}[b]{5cm}
\begin{center}
\psset{xunit=0.35cm,yunit=0.5cm}
\begin{pspicture}(0,0)(0,2)
\listplot[plotstyle=dots]{\BatData}
\end{pspicture}
\end{center}
\end{minipage}
\hfill
\begin{minipage}[b]{7cm}
\begin{flushright}
\footnotesize{\itshape 1007 Mountain Drive {\scriptsize$\bullet$} Gotham City, NY 10027}
\end{flushright}
\end{minipage}
\vskip-2mm
{\hspace{40mm}\hfill\rule[0.5mm]{130mm}{0.5pt}}
\vskip-2mm
\hfill
\begin{minipage}[b]{7cm}
\begin{flushright}
\footnotesize{\itshape 555.555.5555 {\scriptsize$\bullet$} \href{mailto:Bruce@WayneCorp.com}{Bruce@WayneCorp.com}}
\end{flushright}
\end{minipage}

All of the files discussed in this post can be downloaded here, along with a letter Batman would've sent to The Joker.

Tuesday, November 8, 2011

Google Insight Data to Predict Stock Market Trends, Part 1

Previously, I have demonstrated how to install pythonika and why weekends need to be considered in analyzing market trends.  Here I will share my code on importing Google Insights data into Mathematica and provide a neat example of how to parse and analyze the data.

To get started, please install pythonika and download my sample notebook.  Change the first line to point to your compiled executable of pythonika.


Then replace "USERNAME" and "PASSWORD" in the following line with your google account.


Evaluating the python cell, will download the daily search data of "AAPL" in the last 90 days.  To limit the search to the last 30 days, the date variable must be set to "today 01-m."  An important note, any data beyond 90 days are averaged over a week and will need to be parsed in a manner different from the example here.

This command will parse the CSV data for the dates and total daily searches:


Since I am interested in the financials of Apple (AAPL), specifically its daily traded volume, I have set :


The variables googstartdate and googenddate are automatically set to the date range indicated in the first cell.  The next part of the code is used to pair up trading dates with query dates, filter out the weekends, and remove lines with missing data.

There may be a more efficient method of matching two lists of unmatched lengths in Mathematica, but this was the first one I thought up that could account for holidays. Essentially, I have created a set of {dates, queries} and another set of {dates, stock volume} and must match the dates up to create one set of {dates, queries, stock volume}.  First I joined the lists together, then I reordered the two lists by:


The new set will contain disparities from weekends and possibly blank results from the Google Insight data.  To filter out these disparities from the new set, this command is applied:


A quick plot of the filtered data and unfiltered data will show if weekends were properly filtered out.

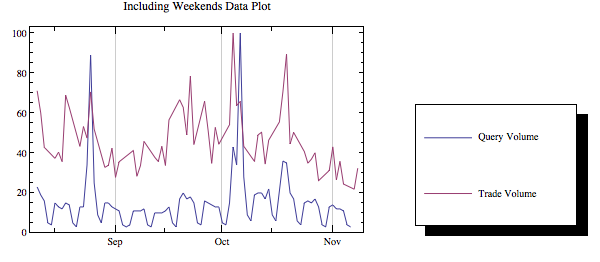
Unfiltered for weekends data

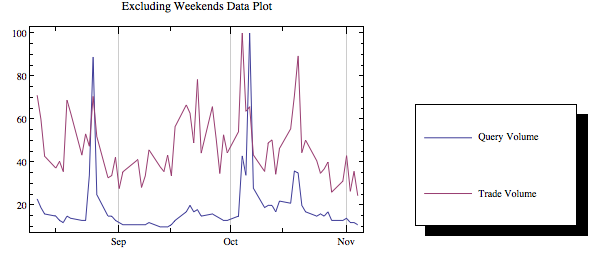
Filtered for weekends data

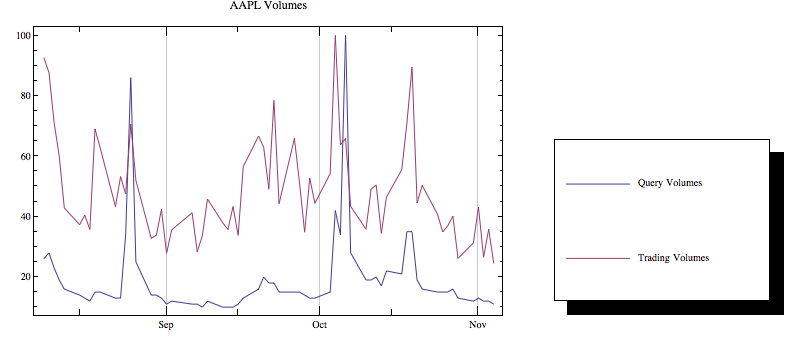
There have been a few papers that prove query volumes can be used to predict trading volumes.  But anyone can clearly see this is not the case with Apple.  This observation can be quantified with a direct Granger Causality test.  I have provided the code necessary to perform the test, but I leave it to the reader to test the lag sensitivity and establish the causal relation or feedback.  I will explain the code used for the Granger Causality test.

To create a new set in the form of {ylag1, ylag2, ylag3, xlag1, xlag2, xlag3, y} with a max lag of 3:


Then to perform the OLS regression and sum the squared residuals:


To compute the test statistic:


And since xlag = ylag, we only need to compute one f-test to get the corresponding p-value by:


The Mathematica notebook for this post can be downloaded here.

Monday, November 7, 2011

Installing Pythonika

Pythonika enables Mathematica to run python.  I ran into some problems installing it with Mathematica 8 and Lion 10.7.2 OS X from the official pythonika webpage.  Here are some quick tips for those performing a similar install.

  • download my appended version, here
  • install 64-bit Python 2.7.1, here 
  • soft link mathlink.framework inside the Mathematica application into the /Library/Frameworks directory using this command in the terminal
    • ln -s /Applications/Mathematica.app/SystemFiles/Links/MathLink/DeveloperKit//CompilerAdditions/mathlink.framework ~/Library/Frameworks/


In my appended version, the main modifications were to the file Makefile.osx.  For everything to compile properly the new makefile changes the CADDSDIR to point to ${MLINKDIR}/CompilerAdditions, deletes the SYS path, specifies CC=g++, and adds -lstdc++ before -framework CoreFoundation.  Simple examples on how to use pythonkia can be found in the Pythonika.nb file on the google codes site.

Web Search Queries Predict Stock Market Trading Volumes, really?

After reading "Web search queries can predict stock market volumes" I decided to replicate the study using Google Insights for Search to look for more meaningful trends.  A more in-depth post will be done later, here I am just presenting some cautious considerations for the readers of the study.

Part of the curious methodology of the paper was its filtering of non-working days.  Using "AAPL" as an example, we can see why.  How would the inclusion of the increased weekend queries influence the tests for granger causality?


Normalized data of daily trading and query volumes for AAPL excluding weekends for last 90 days

Normalized data of daily trading and query volumes for AAPL with weekends for last 90 days

Wednesday, October 19, 2011

American Psycho Business Cards in Latex

I recently tried to find a latex business card template that was similar in design to the cards seen in American Psycho.  I thought Patrick Bateman was the easiest non-Gordon Gekko face saving costume for those Halloween parties, where you are not sure if a costume is required.  Because I can explain to my boss why I am carrying a chain saw in my Valentino suit, but not why I am dressed as Frankenstein's monster.  I was disappointed that no one had posted a template, but extremely happy for a chance to be the first.  I started by borrowing a simple latex business card template from Mike Elery's website.  After playing with the alignment and fonts I was able to create a decent Patrick Bateman card.


Image from vaultofthebankrobber.blogspot.com


It was disappointing to discover that there was no Silian Rail font and no accepted RGB or CMYK of bone color.  The latex font called Palatino, in my opinion, is the closest matching font to Silian Rail.  Since ivory is a bone, I used a ivory background.  

The only deviation from the movie prop is my correct spelling of 'Acquisition.'  A misspelling I did not notice before my attempt to replicate the card.  I think this misspelling was necessary to create the perfect alignment with the company name, which cannot be done simply by shrinking the font or adjusting the letter spacing.  It does add an extra symbolic metaphor that gives me a greater appreciation for the movie.

The PDF output was designed for the business card paper I bought on sale.  If anyone needs to change the output to Avery's brand paper or any other sizing just leave a comment for help.

For fun here is Bateman's Mr. Hyde version of his business card.


Here is the tex sourcefile.

Thursday, June 16, 2011

Exporting .shp Files into XML with shp2text

I have gotten a few emails asking how to install and use shp2text, a program I used in a previous post.  This post will be a step by step guide on how to install shp2text on Mac OS X 10.4 - 10.6.  A version of Xcode must also be installed on the machine for the code to compile.  The original code provided by obviously.com will not compile properly, so here is my modified version that will compile on OS X.

First, unzip onto the Desktop.  Then open up a terminal and type:

cd ~/Desktop/shp2text/

This command will change the terminal directory to the shp2text directory.  If you input "ls" you should see the files in the shp2text directory like Makefile, dbfopen.c, and shapefil.h and etc.  Now simple type:

make

and you should see an output that looks like:

cc -g -c shpopen.c
cc -g -c dbfopen.c
cc -g shpdiff.c shpopen.o dbfopen.o  -o shpdiff
shpdiff.c: In function ‘compareDBF’:
shpdiff.c:539: warning: format ‘%s’ expects type ‘char *’, but argument 3 has type ‘char (*)[512]’
shpdiff.c:539: warning: format ‘%s’ expects type ‘char *’, but argument 4 has type ‘char (*)[512]’
cc -g shp2text.c shpopen.o dbfopen.o  -o shp2text

Now to test if the compilation was done correctly, I have included the sample .shp file provided by obviously.com.  To export the latitude and longitude information with shp2text type:

./shp2text --gpx test/bike-cape_islands-geo.shp 6 0 > test/output.xml

And you will find that an output.xml file, in the test directory, has been created with the .shp data in XML format.  I hope these quick instructions help the confused people out there.

Here is the modified shp2text source code again.

Wednesday, May 25, 2011

Chicago Crime

As a former resident of Chicago I was curious to how much crime happened in the period between  Feb. 18, 2011 and May 15, 2011 and where crimes occurred.  Of course this analysis could be done on EveryBlock, but that is just too easy.  I wanted to do it in Mathematica, incase I want to do any type of advanced analysis later.

The GIS information for the city of Chicago can be found here.  The data must then be unzipped and converted to an XML format, which can be done with shp2text.  The data that is necessary to for this analysis is provided in the downloadable zip file found below.

The first step to the analysis is to extract the GIS data of the city.  To extract the x and y coordinates that make up the polygons of the city of Chicago, the following command was used:


The data used here were of Chicago Police Distracts and historic neighborhoods of Chicago.

The next step was to access the EveryBlock API and gather the crime data.  The API is free to access, you only need to register for a key to use it.  A quirky characteristic about this API is the limited data that is provided.  In the request command I have requested all crimes from January 1st, 2010 but the API will only provide crimes uploaded from the last 24 hours from EveryBlock.  The command to access and isolate the crime data is:


The odd thing about this project is the coordinate disparity.  The Chicago GIS data is provided in a NAD83 transformation rather than just latitudes and longitudes.  This transformation gives x and y coordinates in units of feet rather than degrees and minutes.  To convert the latitude and longitude data gathered from the EveryBlock API this Mathematica command was used:


Now let's get to some pretty pictures and results.  For the period between Feb. 18th, 2011 to May 15th, 2011, the crime distribution in Chicago looked like this:


A count of crime incidents can be performed since we are doing this in Mathematica.  The number of crime incidents in each neighborhood are listed in the table below:


The same analysis can be done with Chicago Police Districts.  CPD publishes monthly crime statistics for each district, I have compiled this information for the month of January 2011 to add a bit more color to the crime map.  In the crime map below, more red the color the higher the incidents of crime in the district.


And the accompanying crime incidents for each district is:


The datafiles used in this blog is provided here.

Monday, April 18, 2011

Google Finance Backfill

During a 3am google search, I stumbled upon this page:

http://www.marketcalls.in/database/google-realtime-intraday-backfill-data.html

It seems that google finance keeps a 15 day minute by minute backfill of all stock quotes.  This was a great opportunity to use Mathematica to do some overly-complicated plotting at 3am.

The parameters to get the data is detailed on the site above.  For the minute by minute quote of JP Morgan for the last 15 days, the Market Calls website suggested using the following URL:

http://www.google.com/finance/getprices?q=JPM&x=NYSE&i=60&p=15d&f=d,c,h,l

The first task was to create a way to download the data for any stock of interest, which was easy enough with Mathematica.

Now the second task was a bit more complicated, since the backfill data kept time in a Unix format (counting the seconds since the birth of Unix).  The following snippet of code can convert this Unix time to a more familiar format.

Then all that is left to do, is to extract and format the price data.

Now it is time to plot!


When insomnia hits again, I may try my hand on some econometrics styled analysis with this data.  For those interested in playing with the code, you can download it here