Recently, CNN did a report on the high number of homicides that is plaguing Chicago. One of the sure fire solutions suggested was to place more police in the areas where these killings occur. It got me wondering where these homicides actually occur.
Using the code from my previous post, I called the crime API that the city of Chicago provides and plotted out all the reported homicides between August 1st, 2011 and May 31st, 2012. There were 403 in total.
Now where did these incidents occur?
Initially it looks as if the homicides are wide spread throughout the city. However, if we do a breakdown by neighborhood it becomes obvious that some are much worse off than others. Below is a table of each Chicago neighborhood and its associated number of homicides between August 1st, 2011 and May 31st, 2012. I've also provided a more convenient graphical representation of this table. The Mathematica code and data files I used for this post can be found here.
Showing posts with label Chicago Crime. Show all posts
Tuesday, July 3, 2012
Wednesday, June 27, 2012
Hidden Markov Model of Chicago Crimes
This is a bit of a side note from my attempts to model the number of daily crimes in the city of Chicago. I've been treating the Chicago crime data as a parametric random process where the parameters of the stochastic process can be estimated in a well-defined manner. My first few attempts used various autoregressive models that assumed the crime data was a signal that cross-correlated with itself. From my knowledge of statistics, this is the proper and prescribed treatment for the data. But I have been wondering how well a strictly stochastic model like the Hidden Markov Model (HMM) will perform.
A hidden Markov model is not that hard of a conceptual stretch when applied to crime modeling. Lets assume that all criminal activities in Chicago evolved according to a Markov process, which may have a finite or infinite amount of states. The underlying Markov process is not directly observable because these states are hidden. Luckily, for each state there is an associated stochastic process which produces an observable signal (a crime report). So as this criminal system in Chicago evolves over time, delegated by the hidden Markov chain, it produces crime reports as observable outcomes.
For a full explanation of the mathematical theory behind HMMs please refer to this article by Lawrence Rabiner. Even though Rabiner focuses on HMM applications to speech recognition, it covers in great detail the theory used in my implementation. To simplify things for myself and to cut down on computation time, I created a hidden Markov model with univariate Gaussian outcomes. The model is fitted using a maximum likelihood estimation, where the values of the parameters are those that maximizes the likelihood of the observed data. Here, I used the Baum-Welch Algorithm for estimating the maximum likelihood.
The observed Chicago crime data is the total number of daily reported crimes between July 1, 2011 and March 31, 2012. A log difference transformation of this data was performed to create a more normal distribution of observables. This is all done in Mathematica with six lines of code:
As an example of how to use these functions, lets generate a two state fit with the log differenced crime data. The first step is to generate a random initial parameter set. To hedge the risk of generating a few really bad initial guesses I chose to generate a set of 20 initial guess and run them for 10 iterations. From this set, I then chose the candidate with the highest loglikelihood. This candidate will then be used as a starting point for fitting the model.
To cut down on unnecessary typing, I have written a Do loop to evaluate models with different number of states and used a For loop to create a table of the different models with their associated BIC.
By the BIC, it seems that a HMM with two univariate Gaussian states is the best model. If we examine the Markov chain equilibrium distribution, it seems crimes in Chicago are at a highly volatile with decreasing crimes state about 91% of the time and a low volatility with moderate increases in crimes state about 9% of the time. Looking at the main diagonal of the transition matrix, the large transitions indicate that if crimes in Chicago are found in one state then it will stay in that state for a while.
That is all for now, I'll try to create a simulation with the HMM data for the next post. All the files used for this post can be found here.
A hidden Markov model is not that hard of a conceptual stretch when applied to crime modeling. Lets assume that all criminal activities in Chicago evolved according to a Markov process, which may have a finite or infinite amount of states. The underlying Markov process is not directly observable because these states are hidden. Luckily, for each state there is an associated stochastic process which produces an observable signal (a crime report). So as this criminal system in Chicago evolves over time, delegated by the hidden Markov chain, it produces crime reports as observable outcomes.
For a full explanation of the mathematical theory behind HMMs please refer to this article by Lawrence Rabiner. Even though Rabiner focuses on HMM applications to speech recognition, it covers in great detail the theory used in my implementation. To simplify things for myself and to cut down on computation time, I created a hidden Markov model with univariate Gaussian outcomes. The model is fitted using a maximum likelihood estimation, where the values of the parameters are those that maximizes the likelihood of the observed data. Here, I used the Baum-Welch Algorithm for estimating the maximum likelihood.
The observed Chicago crime data is the total number of daily reported crimes between July 1, 2011 and March 31, 2012. A log difference transformation of this data was performed to create a more normal distribution of observables. This is all done in Mathematica with six lines of code:
csv = Import[
"https://data.cityofchicago.org/api/views/x2n5-8w5q/rows.csv",
"CSV"];
start = "07/01/2011"; end = "03/31/2012";
range = Join[
First[Position[
If[StringMatchQ[#, start ~~ __], 1, 0] & /@
Drop[csv, 1][[All, 2]], 1]] + 1,
Last[Position[
If[StringMatchQ[#, end ~~ __], 1, 0] & /@
Drop[csv, 1][[All, 2]], 1]] + 1];
crimeseries =
Tally[DateString[
DateList[{ToString[#], {"Month", "/", "Day", "/", "Year", " ",
"Hour12", ":", "Minute", " ", "AMPM"}}], {"MonthName", " ",
"Day", " ", "Year"}] & /@ Take[csv, range][[All, 2]]];
The HMM fitting of the crime data uses three functions I created in Mathematica:
MarkovChainEquilibrium[TransitionMatrix_] :=
Inverse[Transpose[TransitionMatrix] -
IdentityMatrix[Length[TransitionMatrix]] + 1].ConstantArray[1,
Length[TransitionMatrix]];
RandomInitial[Data_, States_] := Module[
{TransMat, i, vnGamma, ProbVec, StateMean, vnQ, StateStD, t, mnW},
TransMat = (#/Total[#]) & /@ (RandomReal[{0.01, 0.99}, {States,
States}]);
ProbVec = MarkovChainEquilibrium[TransMat];
StateMean = ((#/Total[#]) &[
RandomReal[{-0.99, 0.99}, States]]) Mean[Data];
StateStD =
Sqrt[((#/Total[#]) &[RandomReal[{0.1, 0.99}, States]]) Variance[
Data]];
{ProbVec, TransMat, StateMean, StateStD}];
Options[HMM] = {"LikelihoodTolerance" -> 10^(-7),
"MaxIterations" -> 500};
HMM[Data_, {InitialIota_, InitialA_, InitialMean_, InitialStD_},
OptionsPattern[]] := Module[
{TransMat, matAlpha, matB, matBeta, nBIC, matGamma, ProbVec,
StateLogLikelihood, iMaxIter, StateMean, iN, StateNu, StateStD, t,
iT, nTol, matWeights, matXi},
nTol = OptionValue["LikelihoodTolerance"];
iMaxIter = OptionValue["MaxIterations"];
iT = Length[Data]; iN = Length[InitialA];
ProbVec = InitialIota; TransMat = InitialA;
StateMean = InitialMean; StateStD = InitialStD;
matB =
Table[PDF[NormalDistribution[StateMean[[#]], StateStD[[#]]],
Data[[t]]] & /@ Range[iN], {t, 1, iT}];
matAlpha = Array[0. &, {iT, iN}];
StateNu = Array[0. &, iT];
matAlpha[[1]] = ProbVec matB[[1]];
StateNu[[1]] = 1/Total[matAlpha[[1]]];
matAlpha[[1]] *= StateNu[[1]];
For[t = 2, t <= iT, t++,
matAlpha[[t]] = (matAlpha[[t - 1]].TransMat) matB[[t]];
StateNu[[t]] = 1/Total[matAlpha[[t]]];
matAlpha[[t]] *= StateNu[[t]]];
StateLogLikelihood = {-Total[Log[StateNu]]};
Do[matBeta = Array[0. &, {iT, iN}];
matBeta[[iT, ;;]] = StateNu[[iT]];
For[t = iT - 1, t >= 1, t--,
matBeta[[t]] =
TransMat.(matBeta[[t + 1]] matB[[t + 1]]) StateNu[[t]]];
matGamma = (#/Total[#]) & /@ (matAlpha matBeta);
matXi = Array[0. &, {iN, iN}];
For[t = 1, t <= iT - 1, t++,
matXi += (#/Total[Flatten[#]]) &[
TransMat KroneckerProduct[matAlpha[[t]],
matBeta[[t + 1]] matB[[t + 1]]]]];
TransMat = (#/Total[#]) & /@ matXi;
ProbVec = matGamma[[1]];
matWeights = (#/Total[#]) & /@ Transpose[matGamma];
StateMean = matWeights.Data;
StateStD = Sqrt[Total /@ (matWeights (Data - # & /@ StateMean)^2)];
matB =
Table[PDF[NormalDistribution[StateMean[[#]], StateStD[[#]]],
Data[[t]]] & /@ Range[iN], {t, 1, iT}];
matAlpha = Array[0. &, {iT, iN}];
StateNu = Array[0. &, iT];
matAlpha[[1]] = ProbVec matB[[1]];
StateNu[[1]] = 1/Total[matAlpha[[1]]];
matAlpha[[1]] *= StateNu[[1]];
For[t = 2, t <= iT, t++,
matAlpha[[t]] = (matAlpha[[t - 1]].TransMat) matB[[t]];
StateNu[[t]] = 1/Total[matAlpha[[t]]];
matAlpha[[t]] *= StateNu[[t]]];
StateLogLikelihood =
Append[StateLogLikelihood, -Total[Log[StateNu]]];
If[StateLogLikelihood[[-1]]/StateLogLikelihood[[-2]] - 1 <= nTol,
Break[]],
{iMaxIter}];
nBIC = -2 StateLogLikelihood[[-1]] + (iN (iN + 2) - 1) Log[iT];
{"\[Iota]" -> ProbVec, "a" -> TransMat, "\[Mu]" -> StateMean,
"\[Sigma]" -> StateStD, "\[Gamma]" -> matGamma, "BIC" -> nBIC,
"LL" -> StateLogLikelihood}];
The first function computes the equilibrium distribution for an ergodic Markov chain. The second function generates a random parameter set with inputs of the observed data and the number of states. Output from the second function is a list containing the initial state probability vector, the transition matrix of the Markov chain, the mean of each state, and the standard deviation of each state. The third function is the maximum likelihood estimated fit of the HMM. It takes inputs of the observed data and a random parameter set from the second function. The output from the third function is a list that contains the initial state probability vector, the transition matrix, the mean vector, the standard deviation vector, a vector of periodic state probabilities, the Bayesian Information Criterion (BIC) for the fit, and a history of the loglikelihood for each iteration.As an example of how to use these functions, lets generate a two state fit with the log differenced crime data. The first step is to generate a random initial parameter set. To hedge the risk of generating a few really bad initial guesses I chose to generate a set of 20 initial guess and run them for 10 iterations. From this set, I then chose the candidate with the highest loglikelihood. This candidate will then be used as a starting point for fitting the model.
guess = HMM[crimedifference[[All, 2]], #, "MaxIterations" -> 10] & /@
Table[RandomInitial[crimedifference[[All, 2]], 2], {20}];
bestguessLL =
Flatten[Position[#, Max[#]] &[Last["LL" /. #] & /@ guess]][[1]];
hmmfit = HMM[
crimedifference[[All,
2]], {"\[Iota]", "a", "\[Mu]",
"\[Sigma]"} /. (guess[[bestguessLL]])];
It is usually a good idea to check the convergence of the likelihood function to make sure nothing has gone awry.
ListPlot["LL" /. hmmfit, PlotRange -> All]
To cut down on unnecessary typing, I have written a Do loop to evaluate models with different number of states and used a For loop to create a table of the different models with their associated BIC.
MaxGaussians = 3;
Do[InitialGuess["Crimes", i] =
HMM[crimedifference[[All, 2]], #, "MaxIterations" -> 10] & /@
Table[RandomInitial[crimedifference[[All, 2]], i], {20}];
BestGuessLL["Crimes", i] =
Flatten[Position[#, Max[#]] &[
Last["LL" /. #] & /@ InitialGuess["Crimes", i]]][[1]];
FittedHMM["Crimes", i] =
HMM[crimedifference[[All,
2]], {"\[Iota]", "a", "\[Mu]",
"\[Sigma]"} /. (InitialGuess["Crimes", i][[
BestGuessLL["Crimes", i]]])],
{i, 1, MaxGaussians, 1}]
bic = {}; states = {};
For[i = 1, i < MaxGaussians + 1, i++, AppendTo[states, i];
j = "BIC" /. FittedHMM["Crimes", i]; AppendTo[bic, j]]
TableForm[Transpose[{states, bic}],
TableHeadings -> {None, {"#States", "BIC"}},
TableAlignments -> Center]
By the BIC, it seems that a HMM with two univariate Gaussian states is the best model. If we examine the Markov chain equilibrium distribution, it seems crimes in Chicago are at a highly volatile with decreasing crimes state about 91% of the time and a low volatility with moderate increases in crimes state about 9% of the time. Looking at the main diagonal of the transition matrix, the large transitions indicate that if crimes in Chicago are found in one state then it will stay in that state for a while.
Print["Equilibrium Distribution = ", MatrixForm[MarkovChainEquilibrium["a" /. FittedHMM["Crimes", 2]]]] Print["Transition Matrix from Data = ", MatrixForm["a" /. FittedHMM["Crimes", 2]]]
That is all for now, I'll try to create a simulation with the HMM data for the next post. All the files used for this post can be found here.
Tuesday, June 26, 2012
First Attempt at Modeling Crime in Chicago, Part 3
I've been trying to keep my attempts to model crimes in Chicago relatively simple. I was hoping to be able to generate some decent predictions by examining a few months of crime data as a signal using a simple autoregressive moving average model (ARMA). And I've finally made some progress!
I found that a ARMA(2, 3) process acts as a reasonable descriptor for the first difference of the crime data between July 1st, 2011 and March 31st, 2012. The graphs above are simulations for April 2012 that were generated with my regressed ARMA(2, 3) parameters. My choices of using an ARMA model and fitting the first difference of the data is explained in a previous post. The Mathematica code that performs the fitting and diagnostic checks is quite extensive so I may release the work for this post as a package in a later post and document all of the functions then. But if you want to play around with my code and do not mind working with Mathematica, you can find everything used to create this post here (Warning! It is still a work in progress).
Tuesday, June 12, 2012
First Attempt at Modeling Crime in Chicago, Part 2
In the last post, my main goal was to develop a Mathematica 8 program that could regress coefficients for general autoregressive (AR) models. In my excitement, I skipped an essential step of data modeling. I forgot to check if the data could be accurately described by an AR model.
To keep things simple for the remainder of my attempts to model the number of daily crimes in Chicago, I will be using only the data between July 1st, 2011 and March 31st, 2012. This will also give me a reason to use the new Data section of my blog.
\[G_{k}=\frac{V(z_{t+k}-z_{t})}{V(z_{t+1}-z_{t})},\;k=1,2,3...\]
\[d^{k}_{t}=z_{t+k}-z_{t}\]
In Mathematica, a sample variogram can be calculated accordingly:
LagDifferences[list_, k_Integer?Positive] /; k < Length[list] := Drop[list, k] - Drop[list, -k];
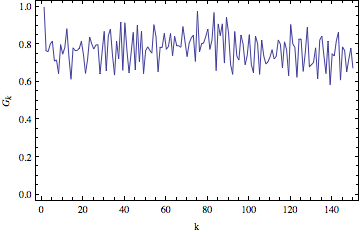
Now we can finally move on to model selection. As a rule of thumb, an AR(p) model can adequately model a set of data if the autocorrelation function (Acf) plot looks like an infinitely damped exponential or sine wave that tails off and the partial autocorrelation function (PAcf) plot is cut off after p lags. Plots of the variogram, autocorrelation function, and partial autocorrelation function for the Chicago crime data and differences of the data are shown below.
It looks like taking the first difference will produce a more stationary time series. The large negative autocorrelation at lag 1 in both the Acf and PAcf plot suggests the data may be better described with a moving average model component rather than with just an autoregressive model. Looks like it is bullocks on me for jumping the gun. I'll be back next post with a moving average model made in Mathematica. Until then, have fun with the source files for this post here.
To keep things simple for the remainder of my attempts to model the number of daily crimes in Chicago, I will be using only the data between July 1st, 2011 and March 31st, 2012. This will also give me a reason to use the new Data section of my blog.
Before examining the legitimacy of an AR model selection, I need to check if the data is stationary. The basis for any time series analysis is a stationary time series, because essentially we can only develop models and forecasts for stationary time series. In my experience, I have found no clear demarcation between stationary and non-stationary data. The usual approach to determine stationarity is to plot the autocorrelation function and if the plot doesn't dampen at long lags than the data is most likely not stationary. This logic escapes me. It may be because my statistical skills come from my engineering and computational chemistry training but I don't think the autocorrelation function is defined for non-stationary processes.
One of the tricks to transform a non-stationary dataset to a stationary one is to take the difference of the non-stationary dataset. So for me, a variogram is the more logical tool for determining stationarity. A variogram gives a ratio of the variance of differences some k time units apart and the variance of the differences only one time unit apart. If you look at the equations below, as k goes to infinity the difference between k lag and k+1 lag will eventually be the same. Ideally, you can conclude a dataset is stationary when the variogram shows a stable asymptote.
\[G_{k}=\frac{V(z_{t+k}-z_{t})}{V(z_{t+1}-z_{t})},\;k=1,2,3...\]
where
\[V(z_{t+k}-z_{t})=\frac{\sum_{t=1}^{n-k}(d^{ k}_{t}-(n-k)^{-1}\sum d^{ k}_{t})^2}{n-k-1}\]\[d^{k}_{t}=z_{t+k}-z_{t}\]
In Mathematica, a sample variogram can be calculated accordingly:
LagDifferences[list_, k_Integer?Positive] /; k < Length[list] := Drop[list, k] - Drop[list, -k];
Variogram[list_, k_] := (#/First@#) &@(Variance /@ Table[LagDifferences[list, i], {i, k}]);
Now we can finally move on to model selection. As a rule of thumb, an AR(p) model can adequately model a set of data if the autocorrelation function (Acf) plot looks like an infinitely damped exponential or sine wave that tails off and the partial autocorrelation function (PAcf) plot is cut off after p lags. Plots of the variogram, autocorrelation function, and partial autocorrelation function for the Chicago crime data and differences of the data are shown below.
| Variogram | |
|---|---|
| Crime Series |
|
| 1st Difference |
|
| 2nd Difference |
|
| Autocorrelation | Partial Autocorrelation | |
|---|---|---|
| Crime Series |
|
|
| 1st Difference |
|
|
| 2nd Difference |
|
|
It looks like taking the first difference will produce a more stationary time series. The large negative autocorrelation at lag 1 in both the Acf and PAcf plot suggests the data may be better described with a moving average model component rather than with just an autoregressive model. Looks like it is bullocks on me for jumping the gun. I'll be back next post with a moving average model made in Mathematica. Until then, have fun with the source files for this post here.
Tuesday, June 5, 2012
First Attempt at Modeling Crime in Chicago
In my last post, I showed how to use the Socrata Open Data API (SODA) to download the data of the crimes reported in Chicago, how to plot the locations, and how to count the number of crimes that occurred in a certain area. This post will chronicle my first attempts to model that data in Mathematica.
The time series analysis add-on to Mathematica 8 costs about $295. So I've decided to write my own autoregressive model (AR) package as a start to modeling the crimes in Chicago. My AR code in Mathematica is based off the FitAR R-package and its associated paper. The mathematics and derivations of autoregressive models are already heavily covered on other websites, so I will not be explaining it here. The alpha version of my code can be found here, note it is not complete and does not yet have all the functions of FitAR or the Mathematica time series add-on.
My code, at this point, does provide fits that are comparable to the FitAR package. Using the default "lynx" data in R the following fits and associated residual autocorrelation plots were produced:
Now that I know my code is correct, the next step will be figuring out if an autoregressive model can properly describe the crime data from Chicago. The lynx data from above is almost trivial when compared to the chaotic mess of crime data.
Just for fun, this is the residual autocorrelation of an AR(5) regressed with the crime series data from above:
Not a model anyone should ever depend on. The files used in this post can be found here.
The time series analysis add-on to Mathematica 8 costs about $295. So I've decided to write my own autoregressive model (AR) package as a start to modeling the crimes in Chicago. My AR code in Mathematica is based off the FitAR R-package and its associated paper. The mathematics and derivations of autoregressive models are already heavily covered on other websites, so I will not be explaining it here. The alpha version of my code can be found here, note it is not complete and does not yet have all the functions of FitAR or the Mathematica time series add-on.
My code, at this point, does provide fits that are comparable to the FitAR package. Using the default "lynx" data in R the following fits and associated residual autocorrelation plots were produced:
Mathematica
| MLE | sd | Z-ratio | |
|---|---|---|---|
| phi(1) | 0.71729 | 0.0652589 | 10.9914 |
| mu | 1537.94 | 364.477 | 4.21957 |
| MLE | sd | Z-ratio | |
|---|---|---|---|
| phi(1) | 1.12428 | 0.0905874 | 12.411 |
| phi(2) | -0.716667 | 0.136707 | -5.24237 |
| phi(3) | 0.262661 | 0.136707 | 1.92135 |
| phi(4) | -0.253983 | 0.0905874 | -2.80374 |
| mu | 1537.94 | 135.755 | 11.3288 |
| MLE | sd | Z-ratio | |
|---|---|---|---|
| phi(1) | 0.820455 | 0.0178649 | 45.9256 |
| phi(2) | -0.632818 | 0.0972914 | -6.50436 |
| phi(4) | -0.141951 | 0.0684639 | -2.07337 |
| phi(5) | 0.141893 | 0.0748193 | 1.89647 |
| phi(7) | 0.202038 | 0.0992876 | 2.03488 |
| phi(10) | -0.314105 | 0.0917768 | -3.42249 |
| phi(11) | -0.368658 | 0.0870617 | -4.23444 |
| mu | 6.68591 | 0.100657 | 66.4225 |
R
| MLE | sd | Z-ratio | |
|---|---|---|---|
| phi(1) | 0.717303 | 0.0652577 | 10.9918 |
| mu | 1538.02 | 363.986 | 4.22548 |
| MLE | sd | Z-ratio | |
|---|---|---|---|
| phi(1) | 1.12463 | 0.0905803 | 12.4158 |
| phi(2) | -0.717396 | 0.1367150 | -5.24738 |
| phi(3) | 0.263355 | 0.136715 | 1.92630 |
| phi(4) | -0.254273 | 0.0905803 | -2.80716 |
| mu | 1538.02 | 135.469 | 11.3533 |
| MLE | sd | Z-ratio | |
|---|---|---|---|
| phi(1) | 0.8204490 | 0.01786005 | 45.937651 |
| phi(2) | -0.6328433 | 0.09731087 | -6.503316 |
| phi(4) | -0.1420888 | 0.06847123 | -2.075161 |
| phi(5) | 0.1421388 | 0.07481409 | 1.899894 |
| phi(7) | 0.2021250 | 0.09927376 | 2.036036 |
| phi(10) | -0.3140954 | 0.09178210 | -3.422186 |
| phi(11) | -0.3686589 | 0.08706171 | -4.234455 |
| mu | 6.6859329 | 0.09999207 | 66.864631 |
Now that I know my code is correct, the next step will be figuring out if an autoregressive model can properly describe the crime data from Chicago. The lynx data from above is almost trivial when compared to the chaotic mess of crime data.
![]() |
| Time Series Plot of lynx data |
![]() |
| Plot of daily totals of crimes in Chicago. |
Just for fun, this is the residual autocorrelation of an AR(5) regressed with the crime series data from above:
Not a model anyone should ever depend on. The files used in this post can be found here.
Subscribe to:
Posts (Atom)